自定义指标-唐奇安通道
引言
我个人在指标上花费的精力较少,一方面是因为市面上已有大量成熟的价格计算公式指标,无需重复开发;另一方面是我更倾向于在EA中实现计算逻辑,便于管理。这是一个公式清晰且应用广泛的指标
唐奇安通道指标概述
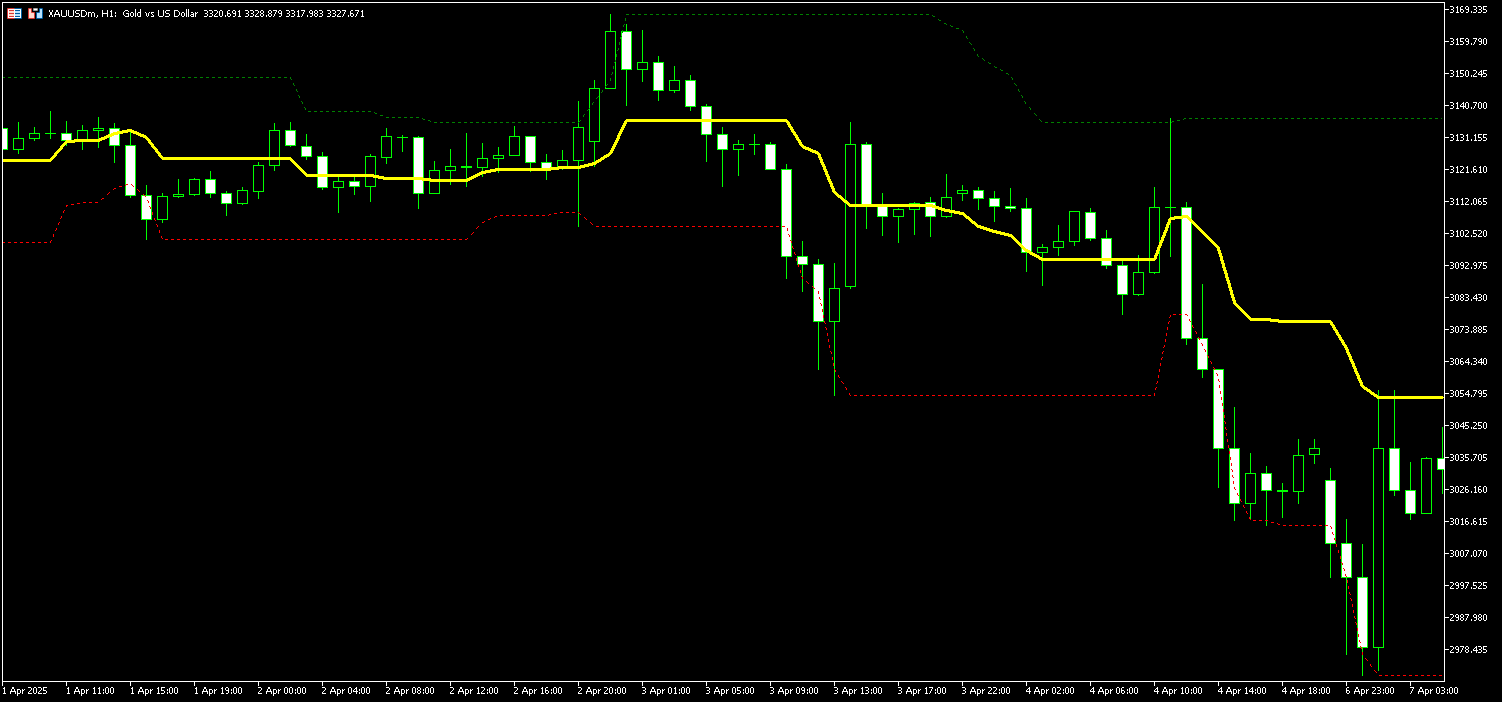
唐奇安通道由三根线组成:上轨、中轨、下轨,用于识别一段时间内的最高和最低价位,类似布林带,适合震荡行情(上轨做空、下轨做多)。
- 上轨:过去N天最高价的最大值
- 下轨:过去N天最低价的最小值
- 中轨:上轨与下轨的算术平均值
指标实现逻辑(代码结构)
指标的代码结构与EA类似,包含三个核心事件函数:
1. 初始化函数 OnInit()
- 执行指标加载时的一次性准备工作,如绑定缓冲区、设置参数等。
cpp
    // 绑定指定的指标缓冲区
    SetIndexBuffer(0,bufferHigh,INDICATOR_DATA);
    SetIndexBuffer(1,bufferLow,INDICATOR_DATA);
    SetIndexBuffer(2,bufferMid,INDICATOR_DATA);
    // 设置指标值的精度
    IndicatorSetInteger(INDICATOR_DIGITS,_Digits);
    // 从那根K线开始画
    PlotIndexSetInteger(0,PLOT_DRAW_BEGIN,InpChannelPeriod);
    return INIT_SUCCEEDED;
2. 资源释放函数 OnDeinit()
- 用于释放指标运行时占用的资源(本案例未使用,可省略)。
3. 计算函数 OnCalculate()
- 每次价格变动时触发,实现指标的核心计算逻辑。
cpp
// 判断K线总数是否足够
    if(rates_total < InpChannelPeriod) return 0;

    // 确定计算的其实位置, 从哪一根K线开始计算
    // 如果prev_calculated为0, 说明是第一次调用, 从InpChannelPeriod开始计算
    // 否则 从上次计算的K线位置开始计算
    int limit =0 ;
    if(prev_calculated == 0) limit = InpChannelPeriod;
    else limit = prev_calculated;

    // 计算DC通道
    for(int i=limit; i<rates_total; i++)
    {
      // start变量 用于确定当前K线往前InpchannelPeriod 根K线的起始位置
      int start =i-InpChannelPeriod;
      // 存储当前K线往前 InpChannelPeriod 根K线的最高价
      bufferHigh[i] = high[ArrayMaximum(high,start,InpChannelPeriod)];
      // 存储当前K线往前 InpChannelPeriod 根K线的最低价
      bufferLow[i] = low[ArrayMinimum(low,start,InpChannelPeriod)];
      // 计算中轨线
      bufferMid[i] = bufferHigh[i]- (bufferHigh[i]-bufferLow[i])/2;
    }
    return rates_total;
完整代码
cpp
/*
  #property indicator_separate_window // 独立窗口
  #property indicator_chart_window  // 主窗口
 */
#property indicator_chart_window

#property indicator_buffers 3
#property indicator_plots 3
// 画上轨线
#property indicator_label1 "High"  // 标签
#property indicator_type1 DRAW_LINE // 画线
#property indicator_color1 clrGreen // 颜色
#property indicator_style1 STYLE_DOT // 样式 虚线
#property indicator_width1 1   // 宽度 虚线设置大于1没有效果

// 画下轨线
#property indicator_label2 "Low"
#property indicator_type2 DRAW_LINE
#property indicator_color2 clrRed
#property indicator_style2 STYLE_DOT
#property indicator_width2 1

// 画中轨线
#property indicator_label3 "Mid"
#property indicator_type3 DRAW_LINE
#property indicator_color3 clrYellow
#property indicator_style3 STYLE_SOLID
#property indicator_width3 3

// 外部输入参数
input int InpChannelPeriod = 20 ; // DC通道周期

// 三个数据
double bufferHigh[];
double bufferLow[];
double bufferMid[];

int OnInit(){
    // 绑定指定的指标缓冲区
    SetIndexBuffer(0,bufferHigh,INDICATOR_DATA);
    SetIndexBuffer(1,bufferLow,INDICATOR_DATA);
    SetIndexBuffer(2,bufferMid,INDICATOR_DATA);
    // 设置指标值的精度
    IndicatorSetInteger(INDICATOR_DIGITS,_Digits);
    // 从那根K线开始画
    PlotIndexSetInteger(0,PLOT_DRAW_BEGIN,InpChannelPeriod);
    return INIT_SUCCEEDED;
}


int OnCalculate(const int rates_total, // 当前可用的K线数量
    const int prev_calculated,  // 上次调用OnCalculate的返回值
    const datetime &time[],
    const double &open[],
    const double &high[],
    const double &low[],
    const double &close[],
    const long &tick_volume[],
    const long &volume[],
    const int &spread[])
{
    // 判断K线总数是否足够
    if(rates_total < InpChannelPeriod) return 0;

    // 确定计算的其实位置, 从哪一根K线开始计算
    // 如果prev_calculated为0, 说明是第一次调用, 从InpChannelPeriod开始计算
    // 否则 从上次计算的K线位置开始计算
    int limit =0 ;
    if(prev_calculated == 0) limit = InpChannelPeriod;
    else limit = prev_calculated;

    // 计算DC通道
    for(int i=limit; i<rates_total; i++)
    {
      // start变量 用于确定当前K线往前InpchannelPeriod 根K线的起始位置
      int start =i-InpChannelPeriod;
      // 存储当前K线往前 InpChannelPeriod 根K线的最高价
      bufferHigh[i] = high[ArrayMaximum(high,start,InpChannelPeriod)];
      // 存储当前K线往前 InpChannelPeriod 根K线的最低价
      bufferLow[i] = low[ArrayMinimum(low,start,InpChannelPeriod)];
      // 计算中轨线
      bufferMid[i] = bufferHigh[i]- (bufferHigh[i]-bufferLow[i])/2;
    }
    return rates_total;
}
最终效果