自定义指标 - 乖离震荡器
指标原理
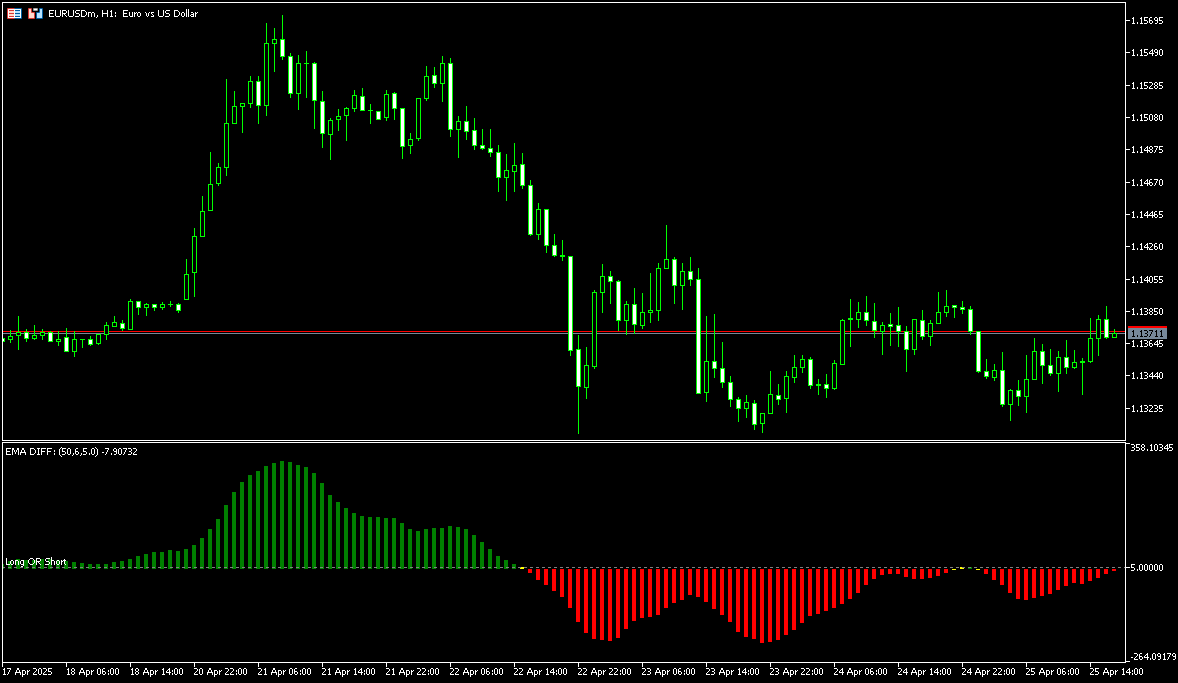
它的表现形式类似于MACD,用法也很相似。我们主要是给大家展示一下这类指标具体是如何实现的。它背后的计算方法非常简单,就是用当前这根K线的均线值与往前偏移一定数量K线的均线值做差,得到这个差值后,就可以以柱状体的形式展示出来。其实它里面的概念和快慢线的乖离程度很相似。这个指标可以告诉我们市场的能量是否还在延续,包括多空的转折点,也可以通过背离的方式识别多空的转换。其实跟MACD的很多用法真的很像。
大部分我们普通人能想到的计算方式,在漫长的金融历史中,已经有无数人想过并验证过了。我们更多的是去学习它背后的理论知识和计算原理。但如果没有售卖指标的需求,最好不要深陷其中。不要总想着自己能开发出一个很神奇的指标一鸣惊人。毕竟对于普通交易者来说,我们更多的是做应用,而不是做研发。现在市面上流传的指标,包括你买到的一些所谓很神奇的指标,其实都是在前人经验的基础上做一些增减,或者做一些界面上的优化,让界面看起来更高端、更智能,好像是新东西,其实深究一下也就那样,没什么神奇的。
代码实现
cpp
#property indicator_separate_window

#property indicator_buffers 3
#property indicator_plots 1

#property indicator_label1 "EMA DIFF"  // 标签
#property indicator_type1 DRAW_COLOR_HISTOGRAM // 画线
#property indicator_color1 clrGreen,clrRed,clrYellow // 颜色
#property indicator_style1 STYLE_SOLID
#property indicator_width1 2
#property indicator_level1 5
#property indicator_levelwidth 1
#property indicator_levelstyle STYLE_DOT

input int InpPeriod = 50; // 周期
input uint InpShift = 6; // 偏移
input double InpLevel = 5; // 水平线

double BufferDiff[];
double BufferDiffColor[];
double BufferEMA[];

int period;
int shift;
int handle_ema;

int OnInit(){

   period = (InpPeriod<1 ? 1: InpPeriod);
   shift = int(InpShift==0?1:InpShift);

   handle_ema = iMA(NULL,0,period,0,MODE_EMA,PRICE_MEDIAN);
   if(handle_ema == INVALID_HANDLE){
      Print("均线指标 加载失败");
      return INIT_FAILED;
   }
   // 数组转换为时间序列
    ArraySetAsSeries(BufferDiff,true);
    ArraySetAsSeries(BufferDiffColor,true);
    ArraySetAsSeries(BufferEMA,true);

    // 指标缓冲区
    SetIndexBuffer(0,BufferDiff,INDICATOR_DATA);
    SetIndexBuffer(1,BufferDiffColor,INDICATOR_COLOR_INDEX);
    SetIndexBuffer(2,BufferEMA,INDICATOR_CALCULATIONS);

    // 颜色设定 在循环中设置也可以
    // PlotIndexSetInteger(1,PLOT_LINE_COLOR,clrGreen);
    // PlotIndexSetInteger(1,PLOT_LINE_COLOR,clrRed);
    // PlotIndexSetInteger(1,PLOT_LINE_COLOR,clrYellow);

    IndicatorSetDouble(INDICATOR_LEVELVALUE,0,InpLevel);
    IndicatorSetInteger(INDICATOR_LEVELCOLOR,0,clrGray);
    IndicatorSetString(INDICATOR_LEVELTEXT,0,"Long OR Short");

    string params = "EMA DIFF: ("+(string)period+","+(string)shift+","+(string)InpLevel+")";
    IndicatorSetString(INDICATOR_SHORTNAME,params);

    // 设置指标值的精度
    IndicatorSetInteger(INDICATOR_DIGITS,_Digits);
    return INIT_SUCCEEDED;
}


int OnCalculate(const int rates_total, // 当前可用的K线数量
    const int prev_calculated,  // 上次调用OnCalculate的返回值
    const datetime &time[],
    const double &open[],
    const double &high[],
    const double &low[],
    const double &close[],
    const long &tick_volume[],
    const long &volume[],
    const int &spread[])
{
    // 判断K线总数是否足够
    if(rates_total < period+shift + 1) return 0;

    // 统计需要计算的K线数量

    int calcCount = rates_total - prev_calculated; // 自上一次K线计算新增的K线数量
    if(prev_calculated == 0) calcCount = rates_total- period-shift-1;// 第一次要从第一个完整的计算周期开始计算


    // 从calcCount 开始, 向前逐个计算每个K线的乖离值
    for(int i=calcCount; i>=0 && !_StopFlag ; i--)
    {
      // 复制均线数据到缓冲区
      // calcCount==0 还没有新的均线产生,就只更新当前均线就可以了
      int copied = CopyBuffer(handle_ema,0,0,(calcCount==0 ?1:rates_total), BufferEMA);
      if(copied < 1 || _Point == 0) return 0;
      // 计算当前K线和偏移后的K线的均线差值
      double ema0 = BufferEMA[i];
      double ema1 = BufferEMA[i+shift];
      double diff = (ema0 - ema1) / _Point;
      BufferDiff[i] = diff;
      // 设置颜色
      if(diff >=InpLevel)
        BufferDiffColor[i] = 0;
      else if(diff <= -InpLevel)
        BufferDiffColor[i] = 1;
      else
        BufferDiffColor[i] = 2;

    }
    return rates_total;
}
最终效果